我们常有的一般都是百度的echart,将数据输出到js里面在渲染出条形图。但是有时候不想把数据输出来,或在项目中不方便使用js情况下!用GD去生成统计图是一个不错的选择!
主要使用https://jpgraph.net项目。
下载地址:https://jpgraph.net/download/
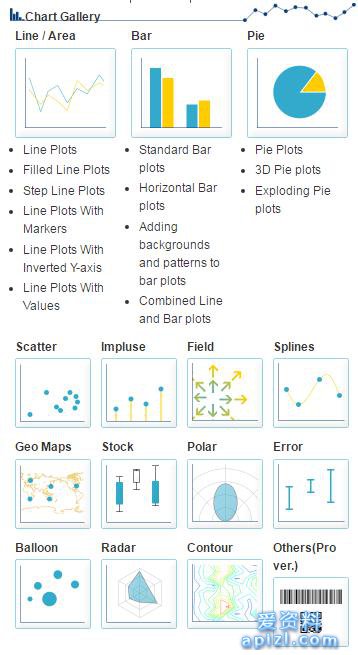
包含条形图、饼状图、树状图、等等https://jpgraph.net/features/gallery.php#line1
在线示例:https://jpgraph.net/features/src/show-example.php?target=new_line1.php
使用示例:https://www.toolnb.com/tools/githubStarRanking.html
生成条形图:https://www.toolnb.com/Tools/Api/getGithubHistoryImg.html?guid=801421f6-34fc-09ef-2655-f4a3093440c2
代码:
        require_once('./jpgraph-4.2.6/src/jpgraph.php');
        require_once('./jpgraph-4.2.6/src/jpgraph_line.php');

       $datay1 = [2,3,4,5,6];

$graph = new \Graph(260, 180);

        $graph->SetScale("textlin");

        $theme_class = new \UniversalTheme;

        $graph->SetTheme($theme_class);
        $graph->img->SetAntiAliasing(false);
        $graph->title->Set('Project Star History');
        $graph->SetBox(false);

        $graph->SetMargin(60, 20, 36, 63);

        $graph->img->SetAntiAliasing();

        $graph->yaxis->HideZeroLabel();
        $graph->yaxis->HideLine(false);
        $graph->yaxis->HideTicks(false, false);

        $graph->xgrid->Show();
        $graph->xgrid->SetLineStyle("solid");
        $graph->xaxis->SetTickLabels([1,2,3,4,5]);
        $graph->xgrid->SetColor('#E3E3E3');

        $p1 = new \LinePlot($datay1);
        $graph->Add($p1);
        $p1->SetColor("#6495ED");
        $p1->SetLegend('Star History');

        $graph->legend->SetFrameWeight(1);

        $graph->Stroke();
参考:https://blog.csdn.net/aoshilang2249/article/details/46956163
关键字词: